The Self-Sufficiency Standard report summarizes the main findings about how much it takes to make ends meet in your state.
For the most recent report in your state, please visit State Data.
Results
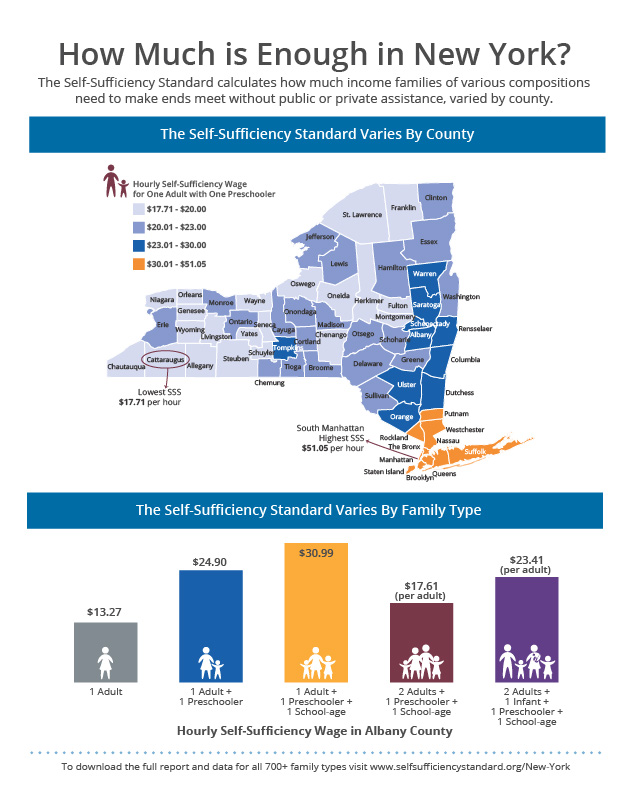
A series of tables and figures which highlight how the Standard varies by family type and location within your state and compared to other states.
How the Standard has changed over time in your state.
How the Standard compares to other income benchmarks such as the federal poverty guideline and the state minimum wage.
Strategies to Meet the Standard
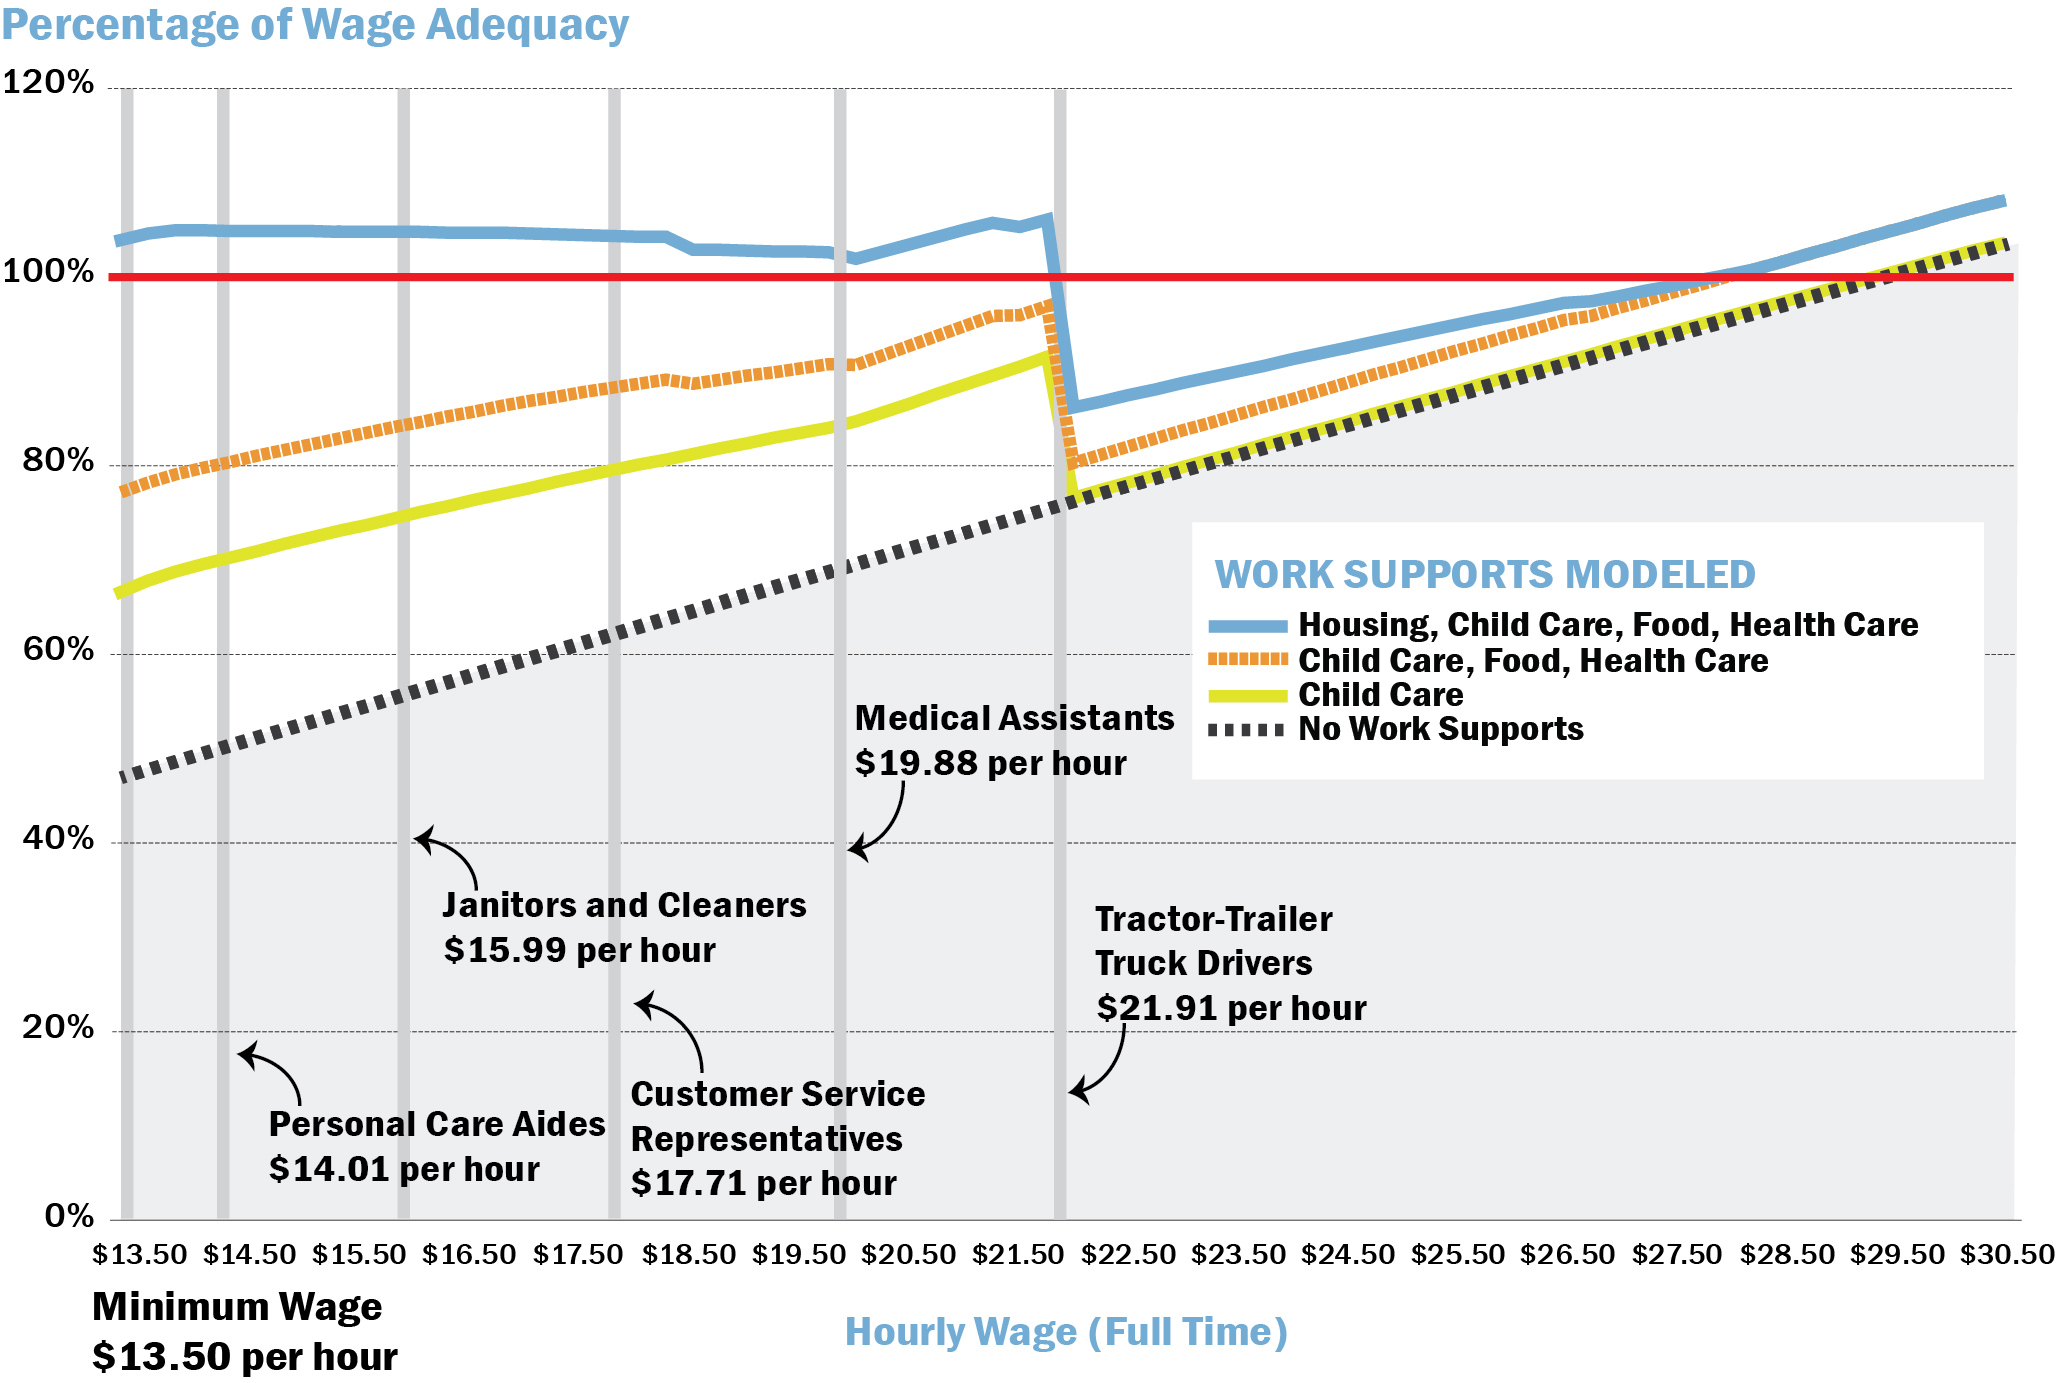
The report outlines strategies to close the gap between low wages and the Self-Sufficiency Standard. This analysis starts with a comparison of the Standard to the wages of the top occupations in your state. Next, we model how receiving work supports in various combinations reduces the income needed to meet the cost of basic needs. A wage adequacy figure will show how adequate wages are, at various levels, with no work supports and with combinations of work supports.
The figure to the left shows the impact of work supports on wage adequacy in Kitsap County (North), Washington State for a family of one adult, one preschooler, & one school-age child.
In addition, the report includes: a key findings section, highlights of the ways that the Standard has been used by our partners to enhance opportunities for achieving self-sufficiency, and appendix tables with full standards for selected family types for each area/county in your state.
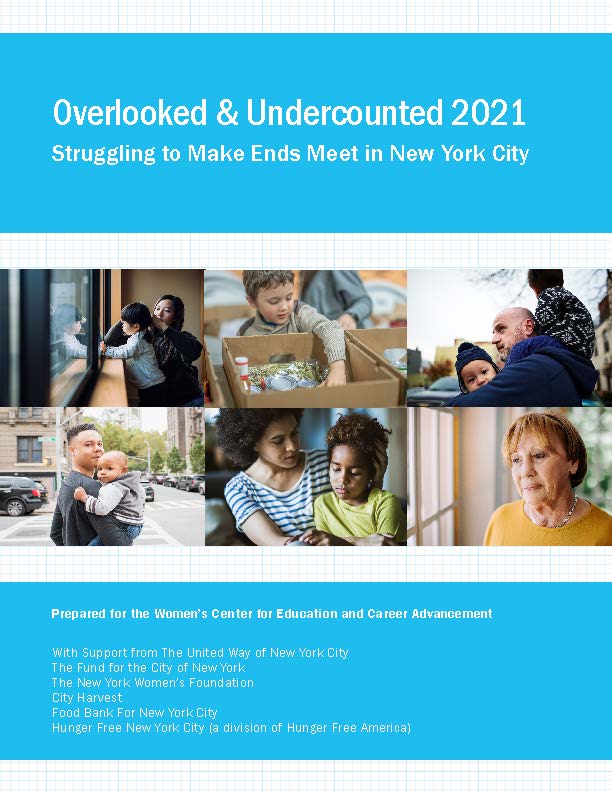
The Center for Women’s Welfare also conducts demographic analyses also known as our Overlooked and Undercounted Series which creates a U.S. Census American Community Survey (ACS) dataset coded with the Self-Sufficiency Standard. This dataset is used to count how many households are above versus below the Standard and looks in-depth at the demographic characteristics of those households.
Results
The report examines the demographic characteristics of households below the Standard by:
race/ethnicity
citizenship
language
geography
family composition
education
and employment-related causes of income inadequacy (such as wages, hours, and occupations) as well as an exploration of how these employment factors interact with race/ethnicity, gender, and household type
The report also includes an Executive Summary, a comparison of findings across selected states, and appendix tables with detailed demographic tables. For states with previous demographic reports, it includes comparisons over time. Additionally, we will provide a SPSS dataset of the ACS coded with the Standard, a documentation file, and an Excel file with statewide data tables of select demographic characteristics of households below the federal poverty threshold and below the Standard. See our most recent demographic reports for New York City, Connecticut, and Colorado.
If partner funding is restricted, CWW also offers a brief version of both reports. Email us for more information on this option.
*The ACS 1-year microdata estimates are typically released in mid-October. If the Sponsor wants to examine the most recent data (2020 1-year estimates in October 2021) this timeline should be considered.